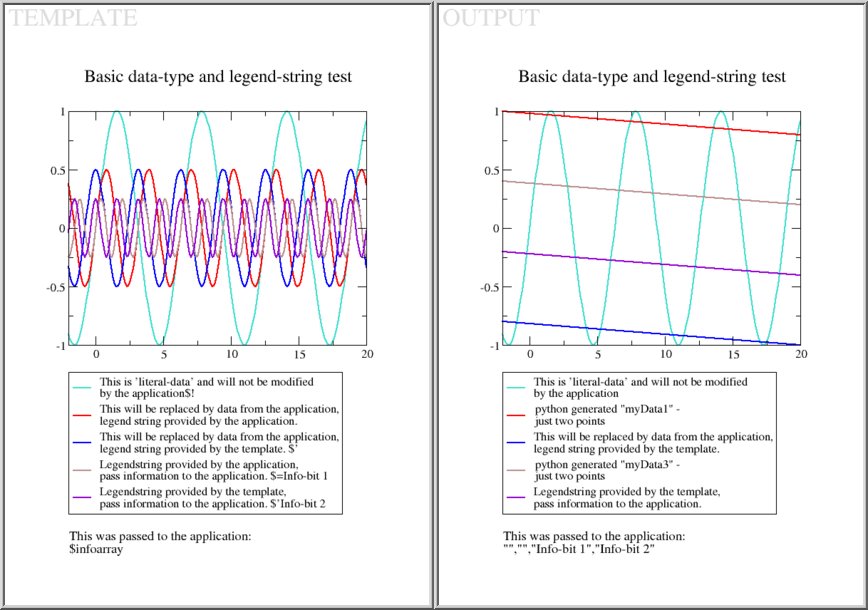
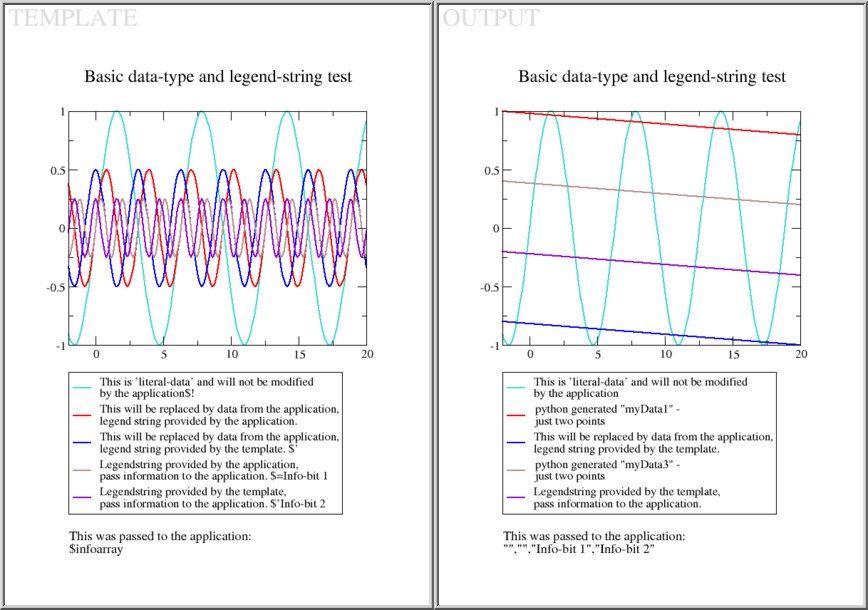
The test is performed using a python script.

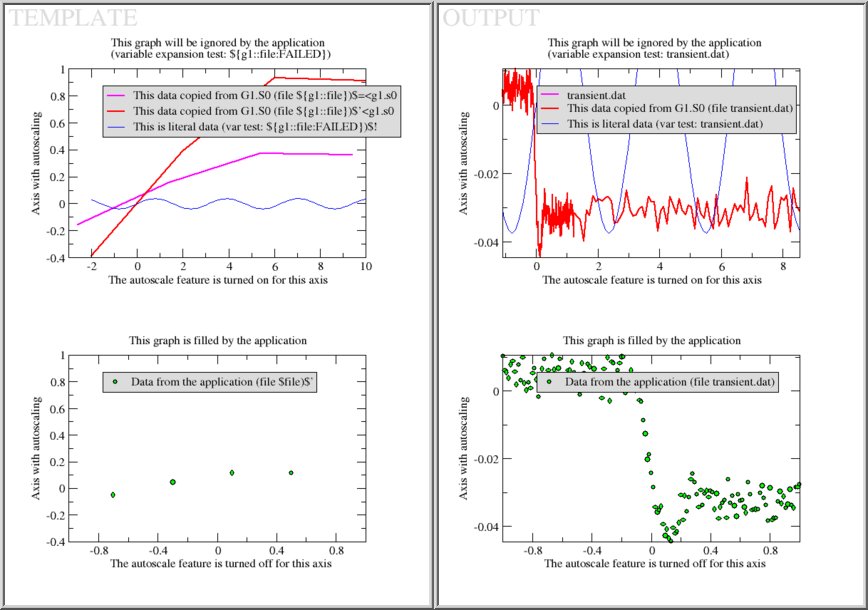
Note the subtle difference between the two copy-data sets in magenta and red: The magenta one copies data from G1.S0 and uses the legend string the application sets for that dataset (which is the filename, transient.dat ), denoted by "$=" . The red copy-data set copies the same data, but uses the legend string provided by the template, as indicated by "$'". As the data points are the same for both the magenta and the red curve, you can only see the latter lying on top, actually.
The test also shows, that autoscaling can be turned off for certain axes (see lower graph) and that literal data is not used for autoscaling purposes (see blue data in upper graph).
The test is performed using the gracetmpldemo application.
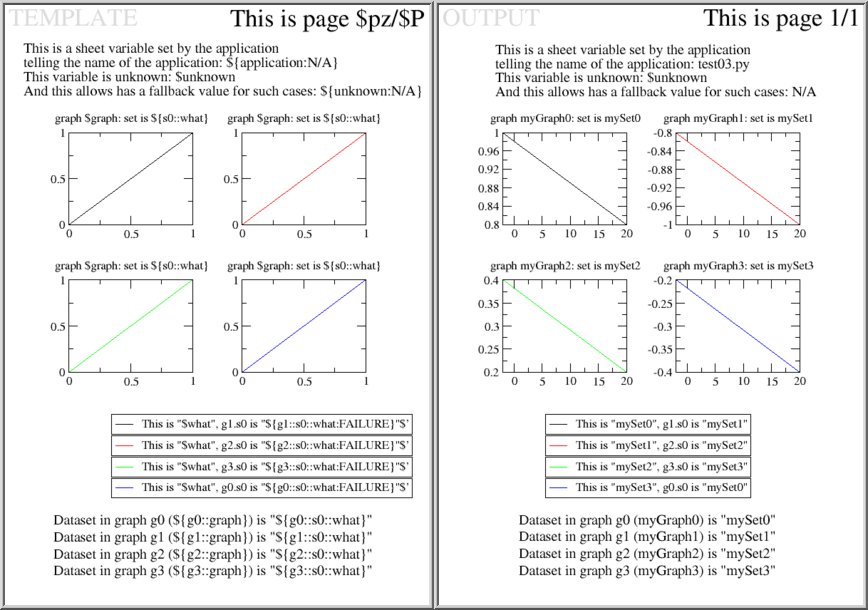
application in the sheet's environment. This variable can be addressed from anywhere in the template (here only demonstrated with text objects). GraceTMPL itself sets the variables pz and P which are the current pagenumber and the number of pages, respectively. Text objects reside in the sheet's environment. All graphs on the page are children to the sheet, as far as environments are concerned.
graph which tells the name of the graph in the application. As shown with text objects and graph subtitles, the variable graph inside a graph can also be accessed from anywhere. Graph environments have the sheet as their surrounding environment and all contained sets as children (see below).
what in all datasets telling the name of that set. As always, these variables can be accessed from anywhere in the template, as shown with text objects and dataset legend strings.Each of the environments can contain any number of variables - which of those are used in the template, is totally up to the template author. Also, if a variable is addresses from within the template that wasn't defined by the application, a fallback value can be used to print instead. Otherwise, nothing happens.
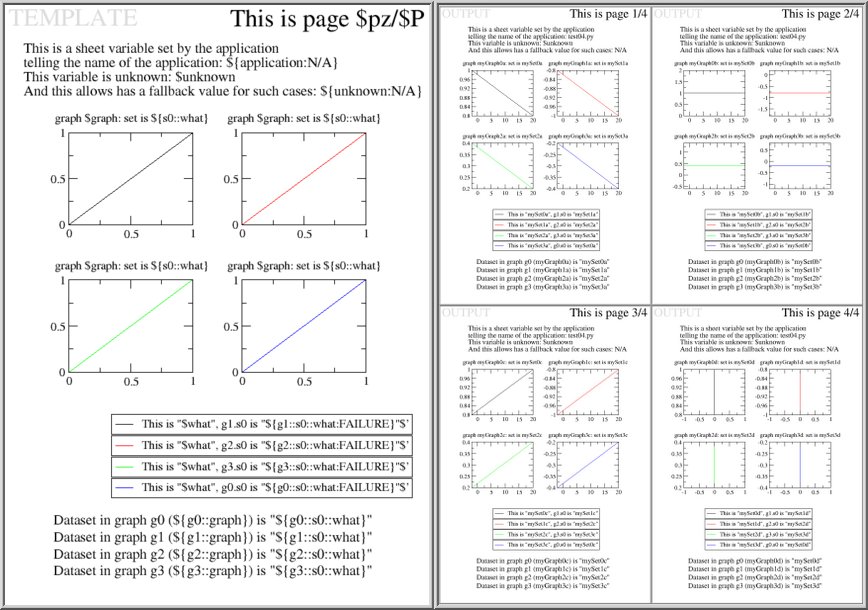
filename-$p.agr ). GraceTMPL automatically outputs as many files as needed to store the requested graphs.The pure horizontal and vertical data on pages 2 and 4 show how autoscale behaves, when the data has no true range in one dimension.
 1.3.2
1.3.2